Preparing a heatmap
You have a table of results from optimizing two hyperparameters of a machine learning algorithm. The table looks like
| alpha | beta | accuracy | |
|---|---|---|---|
| 1 | 0.1 | 0.1 | 0.9 |
| 2 | 0.2 | 0.1 | 0.92 |
| 3 | 0.3 | 0.1 | 0.95 |
Which was generated by looping over values of both alpha and beta and calculating the accuracy given those settings.
import numpy as np

results = []
for alpha in np.linspace(0, 1, 10):
   for beta in np.linspace(0, 1, 10):
      results.append(dict(alpha=alpha, beta=beta,
                          accuracy=accuracy_with_settings(alpha, beta)))
df = pd.DataFrame(results)
Write a function, prepare_for_heatmap(df) which has one column for each value of alpha, one row for each value of beta and the accuracy associated with the pair as the value.
| 0.1 | 0.2 | 0.3 | |
|---|---|---|---|
| 0.1 | 0.9 | 0.8 | 0.7 |
| 0.2 | 0.8 | 0.7 | 0.6 |
| 0.3 | 0.7 | 0.6 | 0.5 |
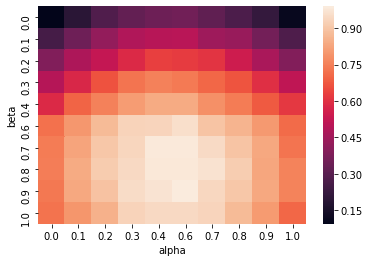
You should be able to use prepare_for_heatmap along with seaborn.heatmap(prepare_for_heatmap(df)) to generate a heatmap like:
Example Input
Code to generate input
results = []
for alpha in np.round(np.linspace(0, 1, 4), 1):
    for beta in np.round(np.linspace(0, 1, 4), 1):
        alpha_contrib = 0.5 - (alpha - 0.5)**2
        beta_contrib = 0.5 - (beta - 0.8)**2
        acc = np.minimum(1, alpha_contrib+beta_contrib+np.random.randn()*0.01)
        results.append(dict(alpha=alpha, beta=beta, accuracy=acc))
df = pd.DataFrame(results)
Table generated
| alpha | beta | accuracy | |
|---|---|---|---|
| 0 | 0 | 0 | 0.112186 |
| 1 | 0 | 0.3 | 0.513274 |
| 2 | 0 | 0.7 | 0.722594 |
| 3 | 0 | 1 | 0.720604 |
| 4 | 0.3 | 0 | 0.319968 |
| 5 | 0.3 | 0.3 | 0.711226 |
| 6 | 0.3 | 0.7 | 0.946665 |
| 7 | 0.3 | 1 | 0.93472 |
| 8 | 0.7 | 0 | 0.330959 |
| 9 | 0.7 | 0.3 | 0.706973 |
| 10 | 0.7 | 0.7 | 0.934994 |
| 11 | 0.7 | 1 | 0.910779 |
| 12 | 1 | 0 | 0.108678 |
| 13 | 1 | 0.3 | 0.510815 |
| 14 | 1 | 0.7 | 0.742989 |
| 15 | 1 | 1 | 0.703605 |
Example Output
| beta | 0.0 | 0.3 | 0.7 | 1.0 |
|---|---|---|---|---|
| 0 | 0.112186 | 0.319968 | 0.330959 | 0.108678 |
| 0.3 | 0.513274 | 0.711226 | 0.706973 | 0.510815 |
| 0.7 | 0.722594 | 0.946665 | 0.934994 | 0.742989 |
| 1 | 0.720604 | 0.93472 | 0.910779 | 0.703605 |
Next Exercise